Political Science Data Analysis Opportunity
Contact


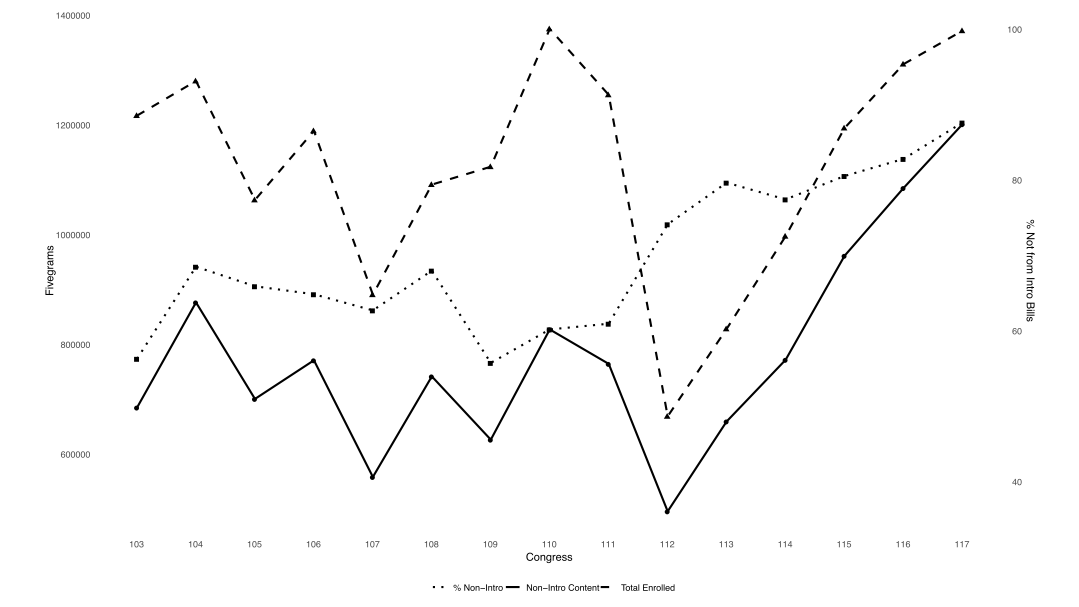
line graph showing the correlation between Congress (x-axis) and Fivegrams (y-axis 1) and percent Not from Intro Bills (y-axis 2). 3 lines are presented with percent Non-intro, Non-intro content, and total enrolled. Overall, the Non-intro content line is the lowest line across the entire x-axis. The Total enrolled starts the highest then drops around 112 and rises back to the highest by 117.

Research Description

This research uses quantitative data to examine political outcomes. Student applicants can have little to no research experience, however, experience with quantitative data analysis and R coding skills is preferred.